Standard Deviation and Variance
- Steve
- Mar 1, 2023
- 2 min read
Updated: Oct 27, 2023
Variance is a measure of variability. Variability - also referred to as spread, scatter or dispersion, describes how far data points lie from each other and from the center of a distribution. While an average tells you where most of your points lie, variability summarizes how far apart they are. This is important because the amount of variability determines how well you can generalize results from the sample to your population.
Low variability is ideal because it means that you can better predict information about the population based on sample data. High variability means that the values are less consistent, so it is harder to make predictions.
Variance is calculated by taking the average of squared deviations from the mean.
Variance tells you the degree of spread in your data set. The more spread the data, the larger the variance is in relation to the mean.
Standard Deviation is represented by the lower case Greek letter 'sigma' σ. It is the average amount of variability in your data set. It tells you, on average, how far each score lies from the mean. The larger the standard deviation, the more variable the data set is.
Calculating it;
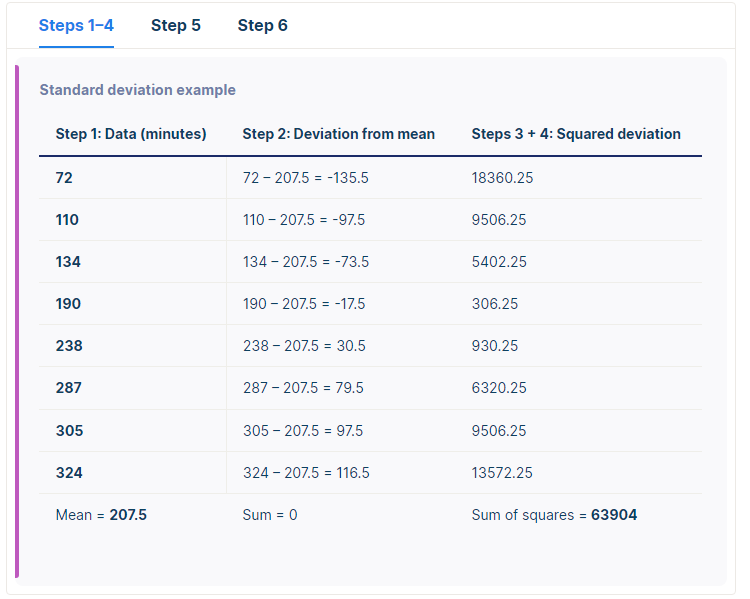
To find the standard deviation by hand;
List each score and find their mean.
Subtract the mean from each score to get the deviation from the mean
Square each of these deviations
Add up all the squared deviations
Divide the sum of the squared deviations by n-1 (n=batch size)
Find the square root of the result


High vs Low
A low standard deviation tells us that the data is closely clustered around the mean, while a high standard deviation tells us that the data is dispersed over a wider range of values.

Why do we use it?
It is used when we want to know if a data point is standard and expected, or unusual and unexpected.
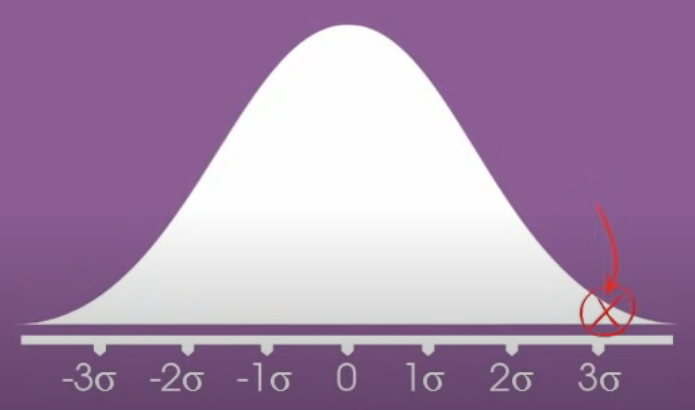
A data points distance from the mean can be measured by the number of standard deviations that it is above or below the mean.
A data point that is beyond a certain number of standard deviations from the mean represents an outcome that is significantly above or below the average;

This can be used to determine whether a result is statistically significant or part of expected variation.
68-95-99.7 Rule
The 68-95-99.7 rule tells us that about;
68% of the data fall within 1 standard deviations of the mean 95% of the data fall within 2 standard deviations of the mean
99.7% of the data fall within 3 standard deviations of the mean

For example; the average height of an American adult male is 5' 10", with a standard deviation of 3 inches. This means that 68% of American men are 5' 10" +/- 3" 95% of them are 5' 10" +/- 6"
and 99.7" of them are 5' 10" +/- 9"
This means only about 0.3% of American men deviate more than 9" from the average.


コメント