

UltraIQ began as a way to answer a capital allocation question.
Before committing serious time or money to a blockchain ecosystem, I wanted to answer something simple: is this network actually being used?
Not talked about, hyped, or promoted.
Used.
Answering that properly meant turning raw blockchain data into something structured and comparable.
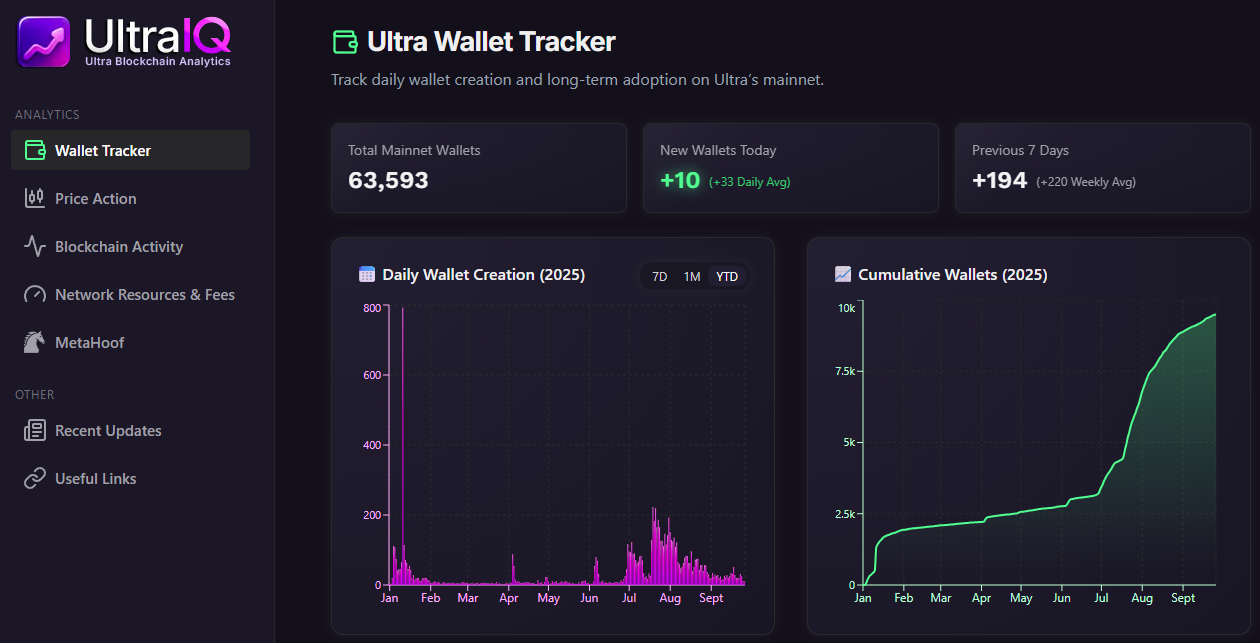
UltraIQ is a live on-chain analytics platform built to measure adoption, economic activity, and structural growth across the Ultra (UOS) ecosystem. It tracks wallet creation, contract deployments, treasury flows, bridge activity, EVM usage, and price data, turning raw blockchain state into structured metrics.
What It Tracks
UltraIQ currently includes:
- Wallet Tracker - daily and cumulative wallet growth on mainnet
- Blockchain Activity - contract deployments, upgrades, and action-level trends
- Bridge - cross-chain inflows and outflows
- Ultra EVM - EVM-side activity and interaction tracking
- Treasury - monitored treasury and strategic wallet movements
- Price Action - contextual market reference
Each module is designed to answer a capital question:
Is the network expanding?
Are developers building?
Is value circulating internally?
Are resources being consumed?
Purpose
Ultra’s architecture links token demand to network utility - RAM purchases, POWER staking, marketplace mechanics, and UOS-denominated fees.
If that linkage works, it should show up in the data.
UltraIQ exists to monitor that loop.
- If wallet growth compounds, that shows up
- If contract deployments cluster, that shows up
- If treasury flows shift toward exchanges, that shows up
- If bridge activity accelerates, that shows up
Narratives come and go.
On-chain activity stays.
UltraIQ connects theory to observable on-chain activity.
Architecture
UltraIQ is built as a modular ingestion and analytics system.
Extraction
- Python-based ingestion
- Ultra Hyperion endpoints for historical actions
- Direct RPC calls for contract state, account data, and resource metrics
- Multi-endpoint failover (eosrio and alternative providers)
Transformation
- Custom ETL pipelines using Pandas
- Normalization of action history into structured datasets
- Aggregation into daily and weekly time-series
- Classification logic for contracts and wallet activity
Storage
- Supabase (PostgreSQL) backend
- Dedicated tables such as
contract_activity, treasury tracking tables, and wallet time-series - Materialized views for weekly rollups and historical snapshots
Visualization
- Next.js frontend
- Recharts for time-series and cumulative analysis
- Structured, investor-focused UI rather than raw block explorer views
Automation
- Cron-based scheduled refresh
- PM2 process management
- Automated weekly rollup updates
The system is designed to extend cleanly. New metrics can be layered in without rewriting the core pipeline.
Who It’s For
- Investors who want to measure usage instead of relying on sentiment
- Builders who want visibility into ecosystem momentum
- Stakeholders monitoring the network
This is not a marketing site.
It is a monitoring system.
Next Phase
Planned extensions include:
- Empires analytics module
- Decentralized exchange (CLOAK) metrics and liquidity tracking
- Network resource analysis (fees and burn)
- Category tagging for deployers (games, infra, DeFi)
- Social and developer signals - GitHub, Discord, Twitter
- Alerts and notifications
As the ecosystem evolves, the dashboard evolves with it.
Stack: Python, Supabase, Next.js, Recharts, Tailwind
Objective: Measure whether Ultra’s on-chain economy is strengthening in ways that justify long-term capital commitment.